Data Science · Level 201
Data Science 201 — Becoming a Data Scientist
Back at Insight Education Analytics, run a binomial test, weigh whether the result matters in practice, and write a client-ready conclusion.
Data Science · Level 201
Data Science 201 — Becoming a Data Scientist
Back at Insight Education Analytics, run a binomial test, weigh whether the result matters in practice, and write a client-ready conclusion.
Data Science 201 — Becoming a Data Scientist
Prerequisite: Data Science 101 — Could I Be a Data Scientist?.
This course assumes you can already use VS Code, Jupyter Notebooks, Python, pandas and matplotlib. We won't reteach those. Instead, you'll run one proper hypothesis test on A-level Computer Science entries.
You are back at Insight Education Analytics. After your exploratory work in Data Science 101, Dr Amara Chen has given you a more demanding assignment. A client has seen that relatively few A-level Computer Science entries are from female students. They need to know whether the pattern is statistically convincing — and how carefully it should be communicated.
Sample student outputs: Worked examples.
Over four work modules you will:
- turn the client's observation into a testable hypothesis;
- prepare and quality-check the relevant data;
- calculate an effect size, run a binomial test and make a chart;
- write a concise client conclusion with honest limitations.
The mindset to keep throughout:
question → hypothesis → quality check → test → interpretation → decision
Create a second notebook in the same notebooks folder:
01_computer_science_gender_test.ipynb
The next sections go inside:
notebooks/01_computer_science_gender_test.ipynb
Module 1 — Frame the Hypothesis
Manager email
From: Dr Amara Chen
Subject: Turn an observation into a testable question
The client believes A-level Computer Science entries are not gender-balanced. Before touching the data, define exactly what that means for England in 2024/25. Give me a hypothesis, a null hypothesis and the measure you will use to judge practical as well as statistical importance.
A vague concern cannot be tested. Make the claim precise.
— Amara
Why this matters
Professional data science starts by deciding what evidence would answer the question. Writing the hypothesis first reduces the temptation to search through results and invent a story afterwards.
Hypothesis
Your hypothesis is:
A-level Computer Science entries in England are not gender-balanced.
More specifically:
The female share of A-level Computer Science entries in England in 2024/25 is lower than 50%.
That is the thing you are testing.
Null hypothesis
The null hypothesis is:
A-level Computer Science entries in England in 2024/25 are consistent with a 50/50 female/male split.
In simpler words:
If subject choice were gender-balanced, about half of Computer Science entries would be female and half would be male.
You will test whether the real data is far enough away from 50/50 that the null hypothesis becomes hard to defend.
What statistical support means
For Computer Science, the data will give you:
number of female entries
number of male entries
total entries
If the null hypothesis were true, and there were 10,000 Computer Science entries, you would expect roughly:
5,000 female entries
5,000 male entries
But real data will never be exactly 50/50. There is always variation.
So the statistical question is:
Is the observed female/male split close enough to 50/50 to be plausible, or is it so far away that we should reject the null hypothesis?
You will use a binomial test.
A binomial test is appropriate because each entry is counted into one of two categories for this analysis:
Female
Male
The test asks:
If the true probability of an entry being female were 0.5, how surprising is the number of female entries we actually observe?
The test gives a p-value.
A p-value means:
The probability of seeing a result this extreme, or more extreme, if the null hypothesis were true.
A small p-value means the observed result would be unlikely under the null hypothesis.
However, you will not rely only on the p-value.
Large datasets can make even small differences statistically significant. So you will also calculate the effect size:
How many percentage points away from 50% is the female share?
For example:
If Computer Science is 15% female, it is 35 percentage points below a 50/50 split.
That is easier to understand than a p-value.
So your conclusion will use both:
p-value = is the result statistically surprising?
effect size = is the difference large in real-world terms?
Module 2 — Prepare the Data
Manager email
From: Dr Amara Chen
Subject: Prove that the counts are trustworthy
Filter the official data to Computer Science, England and 2024/25. Extract the Female, Male and All students counts, then check that Female plus Male matches the published total.
If that check fails, stop. I would rather explain a delay than send the client a confident answer based on the wrong rows.
— Amara
Why this matters
Statistical methods cannot rescue incorrectly filtered data. Reconciliation checks are a simple professional habit: they make assumptions visible and catch mistakes before those mistakes become conclusions.
Load the data
Question
Can Python read the CSV file?
Code
import pandas as pd

path = "../../data/a-level-and-other-16-to-18-results/alevel_timeseries_subject_entries_results.csv"

df = pd.read_csv(path)

df.head()
What the code does
import pandas as pd loads the pandas library. Pandas is used for working with tables.
path stores the location of the CSV file.
pd.read_csv(path) reads the CSV into a table called df.
df.head() shows the first five rows so you can check that the file loaded correctly.
If the extracted folder has a different name, change the path so it matches your computer.
If the columns look wrong, the file may be tab-separated. Try:
df = pd.read_csv(path, sep="\t")
df.head()
Inspect the fields
Question
Does the file contain the fields needed for the test?
Code
df.columnsWhat the code does
This lists the column names.
Check that these columns exist:
subject_name
characteristic_value
entry_count
time_period
country_name
geographic_level
Code
df["characteristic_value"].unique()What the code does
This shows the different student categories.
You need to see:
Female
Male
All students
Code
df["subject_name"].sort_values().unique()What the code does
This lists the subjects in the file.
You need to check the exact spelling of Computer Science in the dataset.
Filter to Computer Science in 2024/25
Question
Can you isolate the rows needed for the hypothesis test?
Code
cs = df[

    (df["time_period"] == 202425) &

    (df["country_name"] == "England") &

    (df["geographic_level"] == "National") &

    (df["subject_name"] == "Computer science") &

    (df["characteristic_value"].isin(["Female", "Male", "All students"]))

].copy()

cs
What the code does
This filters the full dataset down to only the rows needed for the test.
It keeps rows where:
- the year is 2024/25;
- the country is England;
- the data is national-level;
- the subject is Computer Science;
- the category is Female, Male or All students.
The result is stored in a new table called cs.
If this returns no rows, the subject name is probably spelled differently. Search for it using:
[x for x in df["subject_name"].unique() if "computer" in x.lower()]
Extract the counts
Question
How many female and male Computer Science entries are there?
Code
female_entries = int(cs.loc[cs["characteristic_value"] == "Female", "entry_count"].iloc[0])

male_entries = int(cs.loc[cs["characteristic_value"] == "Male", "entry_count"].iloc[0])

all_entries = int(cs.loc[cs["characteristic_value"] == "All students", "entry_count"].iloc[0])

female_entries, male_entries, all_entries
What the code does
The first line finds the Female row and extracts its entry_count.
The second line finds the Male row and extracts its entry_count.
The third line finds the All students row and extracts its entry_count.
int(...) makes sure the values are whole numbers.
The final line displays the three counts.
Run the data quality check
Question
Do Female + Male entries match All students entries?
Code
calculated_total = female_entries + male_entries

calculated_total, all_entries, calculated_total == all_entries
What the code does
calculated_total adds the female and male entries.
The final line displays:
calculated total
official All students total
whether they match
If the final value is True, your filtering is probably correct.
If it is False, stop and investigate before doing the statistical test.
Module 3 — Test and Visualise
Manager email
From: Dr Amara Chen
Subject: Measure the size and strength of the pattern
Calculate the observed female share and its distance from 50%, then run the binomial test. Show the counts in one clear chart.
Report both effect size and p-value. The client needs to understand how large the imbalance is, not only whether software calls it statistically significant.
— Amara
Why this matters
A p-value answers a narrow question about evidence under a null hypothesis. It does not tell you whether a difference is large, important or caused by anything in particular. Data scientists combine statistical output with context and effect size.
Calculate the observed gender split
Question
What percentage of Computer Science entries are female?
Code
pct_female = female_entries / calculated_total * 100

pct_male = male_entries / calculated_total * 100

difference_from_50 = pct_female - 50

pct_female, pct_male, difference_from_50
What the code does
pct_female calculates the percentage of entries that are female.
pct_male calculates the percentage of entries that are male.
difference_from_50 calculates how far the female share is from 50%.
If difference_from_50 is negative, the subject is male-skewed.
If it is positive, the subject is female-skewed.
Run the hypothesis test
Question
Is the female share statistically different from 50%?
Code
from scipy.stats import binomtest

result = binomtest(

    female_entries,

    calculated_total,

    p=0.5

)

result.pvalue
What the code does
from scipy.stats import binomtest imports the binomial test.
female_entries is the number of observed female entries.
calculated_total is the total number of male + female entries.
p=0.5 represents the null hypothesis: a 50/50 split.
result.pvalue gives the p-value.
How to interpret it
If the p-value is very small, the observed split is unlikely under the 50/50 null hypothesis.
That means you have statistical evidence against the null hypothesis.
But the p-value does not explain why the imbalance exists.
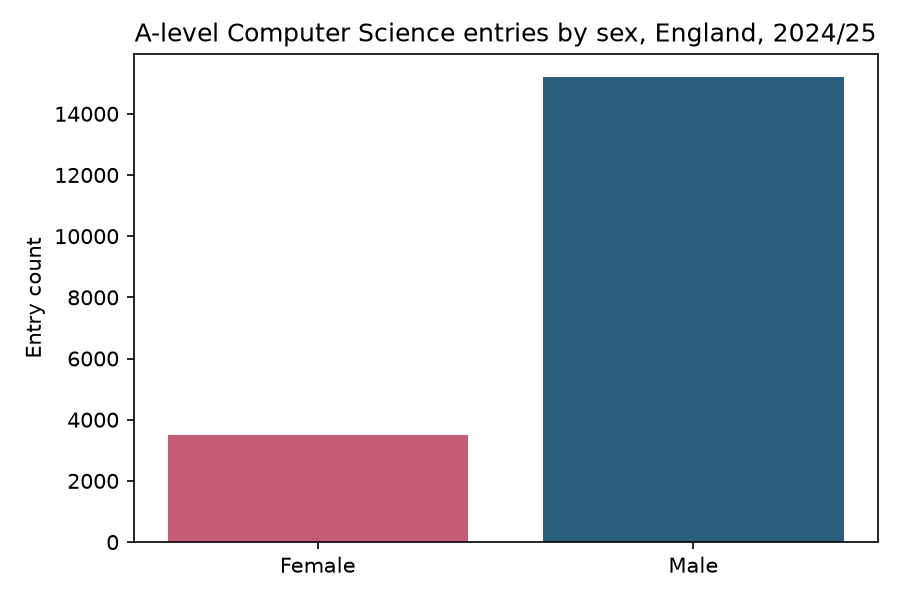
Make one chart
Question
Can you show the gender split visually?
Code
import matplotlib.pyplot as plt

labels = ["Female", "Male"]

values = [female_entries, male_entries]

plt.figure(figsize=(6, 4))

plt.bar(labels, values)

plt.ylabel("Entry count")

plt.title("A-level Computer Science entries by sex, England, 2024/25")

plt.show()
What the code does
This creates a simple bar chart.
The x-axis shows Female and Male.
The y-axis shows the number of entries.
The chart makes the imbalance visible.
Compare with the sample Computer Science gender chart.
Module 4 — Write Up
Manager email
From: Dr Amara Chen
Subject: Brief the client without overclaiming
Turn the analysis into a short client-ready conclusion. State the counts, female share, difference from 50% and p-value in plain language. Then explain the data-quality checks and limitations.
Be direct about what the analysis supports. Do not imply that this dataset explains why students choose subjects.
— Amara
Why this matters
Decision-makers rarely read an entire notebook. A data scientist must translate technical evidence into clear language while preserving uncertainty and limitations.
Write the conclusion
Write a short conclusion in the notebook.
A sample client conclusion is on Worked examples.
Use this structure:
My hypothesis was that A-level Computer Science entries in England in 2024/25 are not gender-balanced, and specifically that the female share is below 50%.
The data showed that there were [female_entries] female entries and [male_entries] male entries.
The female share was [pct_female]%, which is [difference_from_50] percentage points away from 50%.
The binomial test gave a p-value of [p_value].
This means that the observed split is/is not consistent with the null hypothesis of a 50/50 gender split.
However, this analysis only shows the pattern in entries. It does not explain why the imbalance exists.
Data quality and limitations
Add a short section called:
Data quality and limitations
Include these points:
- The data is official education data.
- The analysis uses national England data.
- The analysis uses entries, not unique students.
- The data uses binary categories: Female and Male.
- The analysis tests whether the split differs from 50/50, but it does not explain the causes.
- Subject choice may be affected by school availability, prior attainment, confidence, family expectations, peer culture, teacher encouragement and wider social stereotypes.
- The All students row was used to check that Female + Male entries matched the published total.
Optional extension: compare with another subject
Once the Computer Science test works, repeat the same analysis for one contrasting subject.
Good options:
Sociology
Psychology
Mathematics
Further mathematics
Physics
Do not compare everything yet.
Pick one subject and ask:
Is this subject more or less gender-balanced than Computer Science?
This is a good extension because you are reusing the same method, not learning a whole new one.
Module 5 — What You Have Learned
By the end of Data Science 201, you have learned to:
- state a clear hypothesis and null hypothesis for a gender-balance question;
- load and filter A-level data to isolate one subject and year;
- run a data quality check before trusting your counts;
- calculate an observed split, effect size and binomial-test p-value;
- make a chart and write a conclusion that uses both statistics and plain language;
- describe limitations honestly — what the data shows and what it cannot explain.
These are the core steps of a proper hypothesis test on real public data. You have also practised a central part of the job: turning a client concern into a question that can be tested, checked and communicated responsibly.
Are you becoming a data scientist?
Compared with Data Science 101, this assignment asked for more judgement and less exploration. Reflect on:
- Did you enjoy making a vague question precise?
- Did the quality check change how much you trusted the result?
- Could you explain the p-value without treating it as the whole answer?
- Were you comfortable separating evidence of a pattern from its possible causes?
Developing that judgement — not merely learning more code — is what it means to become a data scientist.
Continue to Data Science 301 to choose and investigate your own question.