Computer Vision (Analyst) · Level 101
Computer Vision Analyst 101 — Reading the Map
Join PDLL as a mapping analyst — research, interpret pixels and filters, and explain the pipeline to a ranger without writing ML code from scratch.
Computer Vision (Analyst) · Level 101
Computer Vision Analyst 101 — Reading the Map
Join PDLL as a mapping analyst — research, interpret pixels and filters, and explain the pipeline to a ranger without writing ML code from scratch.
Computer Vision Analyst 101 — Reading the Map
Prerequisite: Data Science 101.
You need basic Python and notebooks from Data Science 101, but you will not write model code from scratch. You run provided notebooks, inspect charts, and write reports Andy can send to rangers.
Want to implement models in code? Take Computer Vision Developer 101 instead — same PDLL setting, full Python exercises.
Who this course is for
Mapping analysts, GIS trainees and conservation students who may one day use computer-vision land-cover maps — briefing rangers, spotting limitations, asking for ground truth — without building TensorFlow pipelines daily.
Computer vision means teaching a computer to interpret images (here, aerial photos). The Peak District project uses a convolutional neural network (CNN) — a type of model that learns patterns in pixels. You will learn what that output means, not how to code the network.
PDLL is a fictional training team modelled on the published Peak District project (Peak District NPA, Cranfield, Alan Turing Institute, Bluesky APGB).
Your manager is Andy Ipping (Senior Data Analyst). He cares whether you can
read a map critically, not whether you can spell Conv2D.
Before you start
Download
land-cover-analyst-101-starter.zip
and extract to ~/coding/analyst101.
Open the folder in VS Code. Save written work in report/.
Install trouble? Modules 1–4 need only numpy, matplotlib and Pillow. Module 5 optionally uses TensorFlow — or study the worked example charts and skip the notebook if TensorFlow is blocked on your laptop.
Module 1 — Why Map From Above?
No coding. Same research task as the developer course.
Create report/module1_land_mapping_research.md (300–500 words):
- Why can't a park rely on field survey alone for 1,439 km²?
- One documented use of the published map (press release or Turing impact page).
- Two questions you would ask a ranger before they trust an AI-drawn habitat boundary.
Sources: 2023 press release, Turing impact story.
Module 2 — Inspect the Pixels
Your task
- Open
notebooks/module2_explore.ipynb. - Run All cells.
- Complete
report/module2_notes.md:- Which band looks brightest green? Darkest overall?
- Do the printed RGB values match your predictions?
- What does the greenness profile tell you — and what does it not tell you?
Expected charts: data/peak_tile.png, outputs/charts/module2_green_profile.png.
Compare with the worked examples.
You are learning to treat an orthophoto as numbers, not magic — the same view a developer sees before they train a model.
Module 3 — Edges & Texture
Your task
- Open
notebooks/module3_edges.ipynb. Run All. - Write
report/module3_filter_note.md(three sentences):- What did the edge filter highlight?
- Which land band had the strongest average edges?
- Why is edge strength alone not enough for a full park map?
Open outputs/charts/module3_edges.png in Explorer and compare to peak_tile.png
before you write — the chart should match boundaries you see with your eyes.
Module 4 — Explain the Pipeline
No new code. Write report/module4_cnn_explainer.md (400–600 words) for a
ranger who has never heard of tensors:
- Scenario — mapping the Peak District from Bluesky APGB photos.
- Four stages — how a convolutional neural network (CNN) finds patterns: filters, pooling, deeper layers, classification (plain English).
- Two-pass pipeline — broad classes first, subclasses second.
- Diagram — boxes from aerial patch to habitat label.
- One limitation — when would you not trust the model alone?
Developer course Module 4 covers the same ideas with more technical detail if you want a reference.
Module 5 — Read Model Outputs
A developer trained a tiny land-cover model on synthetic tiles. Your job is to interpret the results — not rebuild the architecture.
Option A — Run the notebook (if TensorFlow works)
Open notebooks/module5_read_results.ipynb. Run All.
Write report/module5_results.md:
- Test accuracy (one sentence).
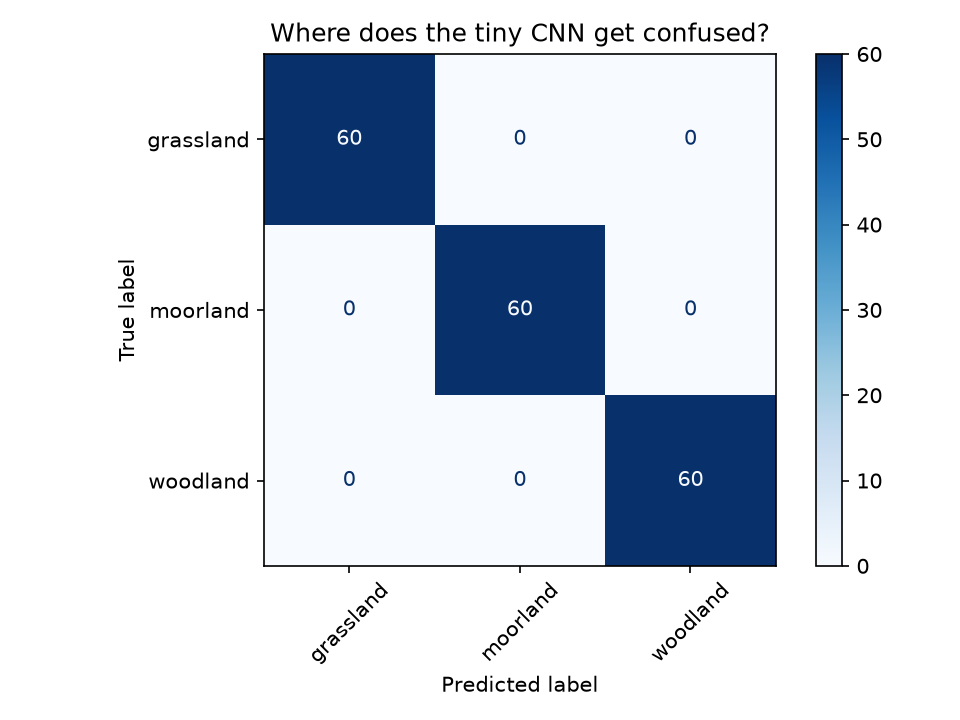
- One confusion the matrix reveals.
- One limitation of applying this toy model to real APGB imagery.
Option B — Study worked outputs (no TensorFlow)
Open these from Worked examples:
- Confusion matrix
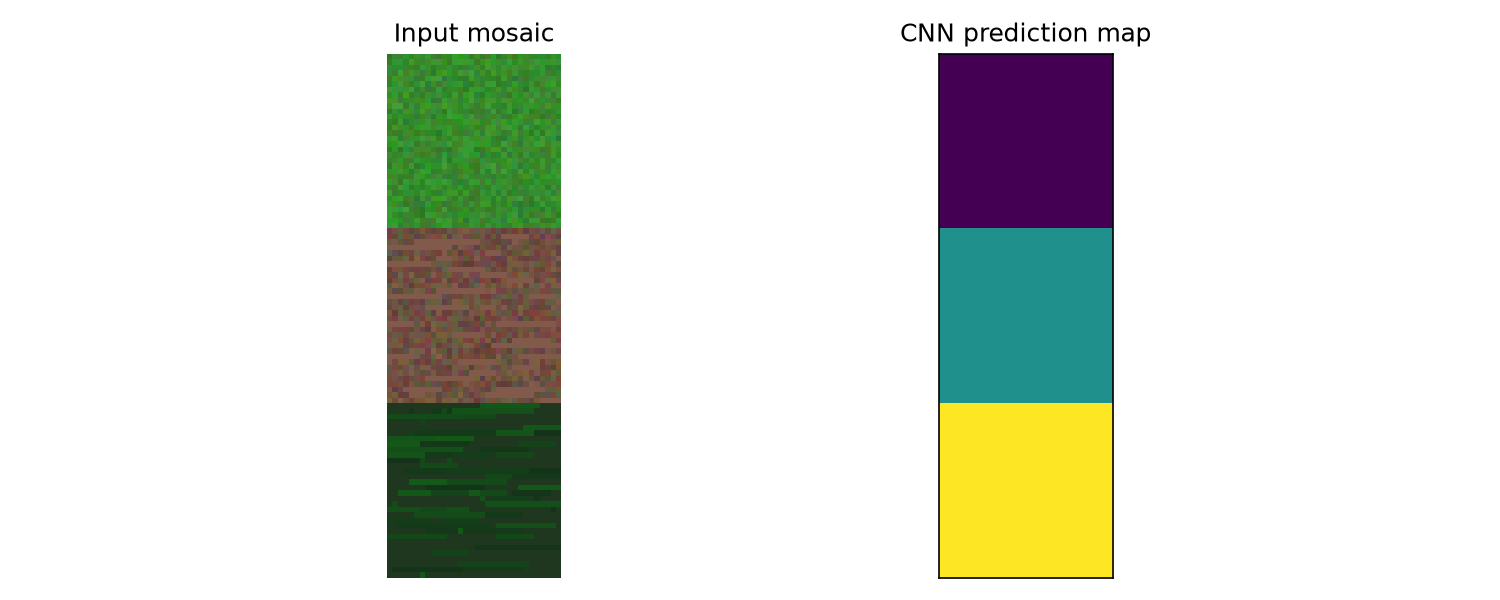
- Prediction map
- Sample results note as a format guide — write your own answers.
Module 6 — What You Have Learned
Write report/module6_reflection.md (200–300 words):
- Would you enjoy briefing rangers on map uncertainty?
- What surprised you once you saw pixels and filters?
- Do you want Computer Vision Analyst 201 or Computer Vision Developer 101 next?
Next steps: Computer Vision Analyst 201 — EuroSAT, confusion matrices and the park brief.